Saturday 22 February 2014

An update

Long time since the last post. Sorry, lots of things been getting in the way. I've had a leak in the roof of my van which has needed a lot of attention to try and track down are repair. In the process I had to remove the cab floor as it's foam backing was sodden.

Anyway, I did get a moment to make a nice hardwood bezel for the display unit for the battery monitor. I made it out of a piece of mahogany I got from the Bristol Wood Recycling project.


This is displaying the display I was working on with the touch-screen LCD I got to attach to an Arduino Mega clone.

I just need to wire it all up now and get back to working on the actual software.

In another development I managed to work out how to send data via GPRS with my GSM module, so I might use that and transmit the battery data to a web service running elsewhere rather then storing it locally on an SD card.

Wednesday 29 May 2013

Calculating State of Charge from Terminal Voltage

So now I have some data, I need to calculate the state of charge from the terminal voltage. My plan is to watch the current and voltage readings over time and try and take a voltage reading once the battery has been 'at rest' for a period of time. In reality the battery is always in use in some way, as seen by the graph in the previous post. However overnight there is no charging as the solar panel produces no output. The fridge cycles on and off, but I hope to be able to take the highest voltage reading before the voltage drop in the cycle happens.

Once I get that voltage reading I need to convert it into an estimation of the state of charge of the battery. I managed to find a good table that lists state of charge versus voltage and that is temperature compensated. I have a temperature probe on the battery terminal to measure the temperature. As I use the van all-year-round and live in the UK and sometimes go to France, this means the battery temperature could vary from 0 to 30 degrees C.

The table I found is on Battery FAQ and has a spreadsheet that lists no only voltages for normal lead acid batteries, but also those with calcium in. The penny has now dropped that my Lucas LX31MF batteries are calcium batteries. This explains why they settle at 12.80V instead of 12.65V. Also why they seem to need a higher charging voltage. I think for the past few years I have been charging them at too low a voltage and hence their poor performance.

I took the tables in the spreadsheet and ran them through some curve-fitting software to work out an equation that best fits the values. This makes is much easier for me to calculate the temperature compensated voltage and the SoC. The equations I came up with in the end for a calcium battery are:

# Given voltage and temperature return a corrected voltage
def tempcomp(v, t):
    return v + (4.775e-05 * t ** 2 + -0.0034 * t + 0.0581)


# Given voltage return an estimate of the state of charge of battery
def vtosoc(v):
    return (v - 11.76) / 0.0104

Of course these are approximations  Even worse they are approximations taken from random data on the internet, and not from data specific to my battery. But then, my battery manufacturer  Lucas, doesn't publish battery data. Given that most battery monitors out there don't allow you to input any parameters other than just the battery bank capacity, I think I'm doing at least as good as they are.

Tuesday 28 May 2013

Data!

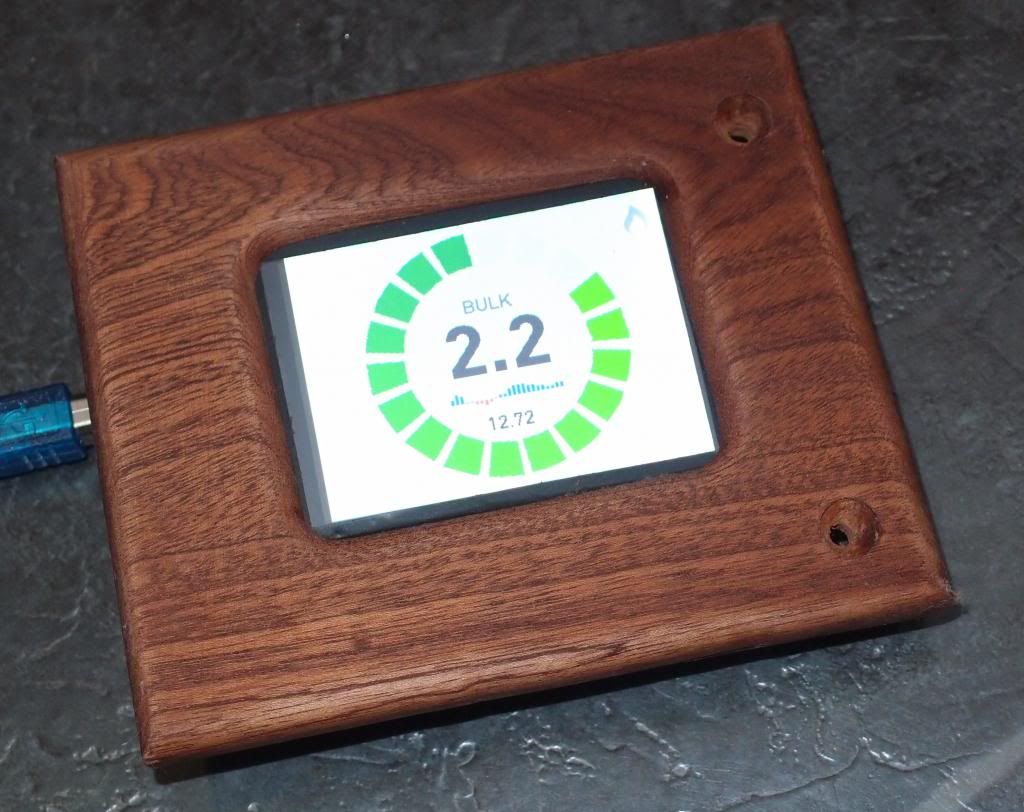
So, I finally have some actual real, useful data captured!

This last weekend was a bank holiday weekend in the UK and so we went camping down in Weymouth by the sea. We drove down Friday evening and left Monday afternoon. So we were there for three nights. There was no electrical hookup, so we would be relying on the batteries alone. We've stayed that length of time before just on batteries, but I've never been able to instrument how the batteries were doing and was never very sure of how well they were working. My gut feeling was always that we were running dangerously low at the end.

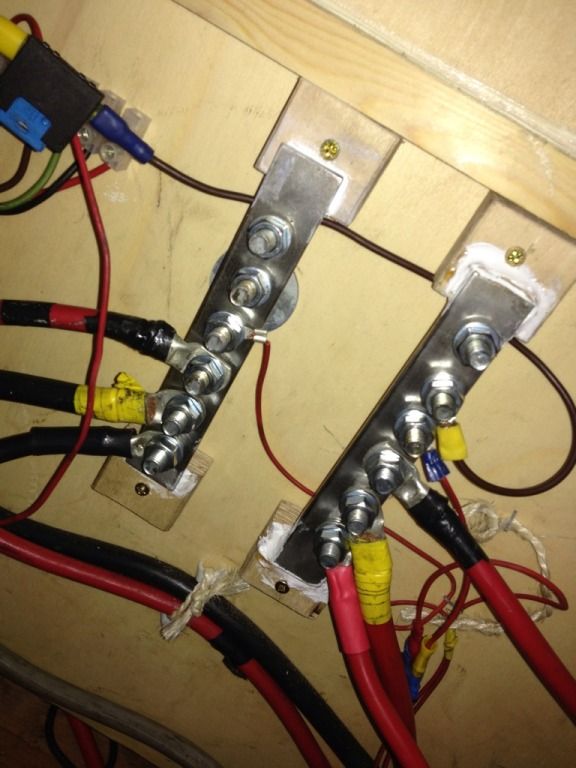
Since then I have re-done the main battery cabling and built some new bus bars, and so I think the connections are much better. I've also got a much better ground connection as well, using a M8 rivnut into the van floor rather than just a 3mm pop rivet. I've also dropped one battery. I originally had 3 x 115Ah batteries, but I feared one (at least) was dead and removed it. So I'm now just running on 2 x 115Ah batteries.

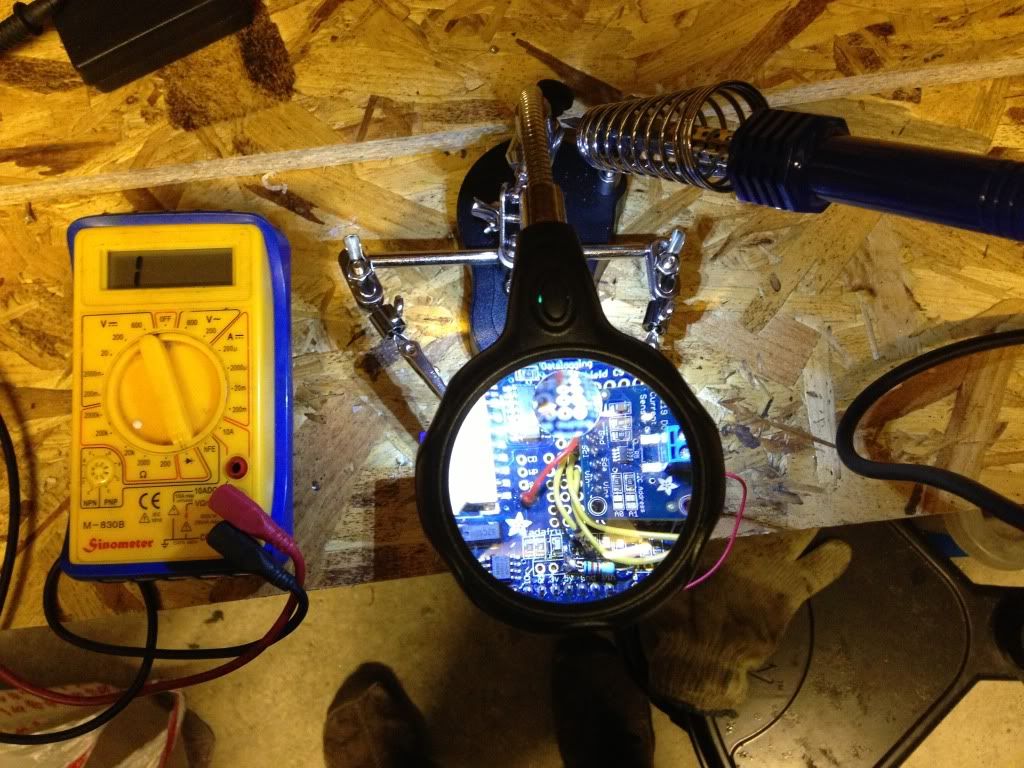
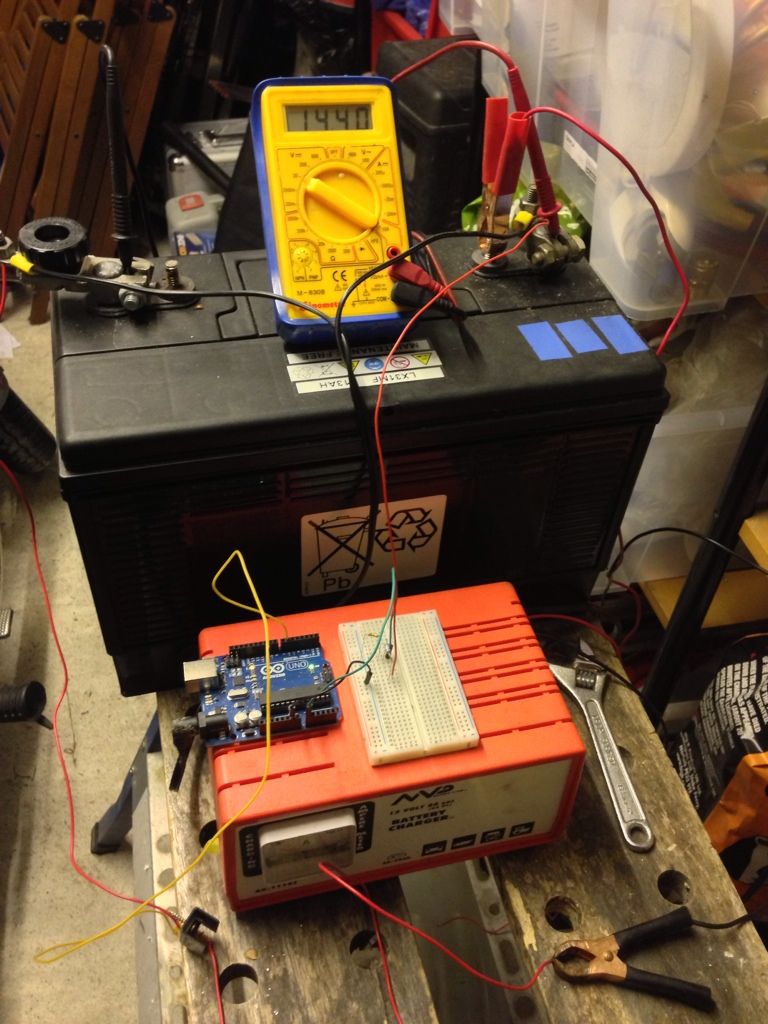
The Arduino battery monitor was set to record voltage, current and temperature every second to an SD card. The temperature was measured using a one-wire temperature probe that was taped to the negative terminal of one of the batteries.

Before I get on to the results.... let me just say, I can now understand why so many battery monitors out there give misleading readings, and why some of the papers I read on estimating battery capacity are so complex... the graph results are so complex. The end goal I'm aiming for here it to somehow reduce the mass of numbers I've accumulated into just one. A current battery capacity... e.g. 85%. Maybe even some kind of runtime until empty. But when you see they graphs you will realise why that is going to be so difficult.


Voltage and Current over Time
You will want to click on the image to enlarge it. It shows the raw voltage and current captured over the 3 days.

So I should probably talk through the top graph as to what exact was happening.

Thu 21:00: graph starts. Data is being captured, there is no solar charging as it is night time, and the compressor fridge is switched off. Nice smooth line with the voltage dropping slightly over time as surface charge from solar earlier that day drops off. Settles around 12.9V.

Fri 06:00: Sun comes up, voltage rises to a peak of 13.3V and current increases slightly due to charging from solar panel. We are on float charge.

Fri 08:00: I switch the compressor fridge on and load it with food for later, I also drive it from outside the house to the parking spot around the corner (so warden won't ticket me). You see a very brief spike in voltage as the engine charger kicks in taking the voltage up to 14.6V. The compressor fridge brings the voltage down and the graph starts to get 'messy'. The compressor on the fridge kicks in every 5 minutes and runs for a few minutes. This is what causes the min and max on both the voltage and current lines.

Fri 15:00 The sun comes out and the solar panel is now putting in as much as being taken out by the compressor fridge. You can see the highs of the current (red) line going above zero. The voltage is also going up to highs of 14.5V. The voltage oscillates a lot due to both the compressor fridge and also passing clouds.

Fri 18:00 I start the engine and we drive down to Weymouth. The drive is approx 2.5 hours. You can see the engine charge has kicked in and bringing the voltage max up to 14.7V. The current spikes up and down, but you can see a core downward trend on the current during the charging to finish at about 2A. As the battery is fairly well charged still and the solar panel kept up with the demand of the compressor fridge over the day, this is what I would expect. The engine charger doesn't need to put much charge into the batteries.

Fri 21:00 We are at the campsite and the sun has now pretty much gone down. The solar panel is not generating any power and the engine is off. You can see a baseline max current of 0A. ie, nothing. And a baseline minimum of around -4A. That is the compressor fridge drawing 4A of current from the batteries. You can see the voltage also drops down to a baseline max of around 12.8V and a min of around 12.6V. When the compressor fridge runs, the draw on the batteries causes the battery voltage to drop. You can see a slow downward trend overnight as energy is drawn from the batteries.

Sat 06:00 The sun starts to rise and you can see both the voltage and current increase.

Sat 10:00 A sudden drop for a while on both voltage and current. This is due to me unplugging the solar panel to see what the battery would settle to with no input.

Sat 11:00 The current rises following an arc as the sun moves across the sky. It was a pretty sunny day with no clouds. 

Sat 15:00 The solar panel has brought the voltage back up to a peak of 14.4v. So we could infer from this that the batteries have managed to reach full charge again (minus a 'topping off' charge or absorption phase').

Sat 17:00 Sudden drop in current and voltage. I've started up the Webasto diesel heater to heat some hot water for a shower. This heater has a pump that draws quite a bit of current, plus the glow plug for the heater which draws a lot to start with.

Sat 20:00 The sun is down, the van batteries are now losing their surface charge and again we start a night of the compressor fridge running and energy being drawn from the batteries. Once the surface charge is lost you see a slow downward trend on the voltage ending with a baseline max of around 12.7V. You see a number of very big downward current spikes to around -15A which I think may be that the reading was taken exactly as the compressor kicked in and that is the inrush current on the compressor motor.

Sun 06:00 The sun starts to rise again and the solar panel starts to bring the current and voltage up. We spent the day at the beach. It was a glorious sunny day. You can see the voltage and current rise and fall with the sun.

Sun 09:00 Short sharp dip as I fire up the heater to heat some water for a shower.

Sun 18:00 Another short dip as I fire up the heater again to make sure there is hot water to wash salt and sand of a very happy but tired 2 year old daughter who spend the day playing on the beach.

Sun 20:00 The sun is down, the surface charge is coming off the batteries and the current is alway negative as there is no charge source. Another night with just the compressor fridge drawing energy. The voltage drops to a baseline max of around 12.65V and a min of around 12.48V.

Mon 06:00 Sun is rising and current and voltage increase.

Mon 09:00 Heater on again for a bit for hot water to wash up.

Mon 14:00 We leave the campsite and start to drive home. You can see the engine charger kick in and take the current up to a peak of around 9A. Considering the charger can go up to 50A this seems a bit low, but I guess the batteries will determine how much current they will accept. The voltage is up to around 14.7V. The engine charger takes a break every 20 minutes to let the vehicle battery get some charge and to assess the charge situation. That is why there are voltage drops as we go along. You can see a steady downward trend on the current as the batteries charge and reduce how much they accept. This finishes at around 2A.

Mon 17:00 We are home. The van is parked up. For a while the compressor drieg keeps running until I get out to empty the fridge of things we didn't eat, and then switch it off. You see a small tail at the end of smooth line. The current is 0A and the voltage is around 13.12V.

So the big question is what does that all mean? How did the batteries hold up? How much charge did we take out of them? How long could we have stayed there before the batteries 'ran out'? Did the batteries get fully charged by the time we got home? So many questions! Well I'll answer them in the next blog post as I need to go get some real work done first!

Friday 24 May 2013

Out of Memory :(

I went out the the van last night and connected up the Arduino to the current shunt and battery and left it recording to the SD card. Alas, when I went out, the SD card had nothing on it.

After a long time messing about with it, and fearing I may have accidentally fried the SD Card, I worked out that the Arduino was out of memory. The Arduino One clone that I am using only has 2KB of SRAM to use. So all the variables that you define, strings you assign, etc. all have to fit in that 2KB. Which is really not a lot of room. Especially when you consider I don't actually have the State of Charge code written yet! So I'm out of memory and I haven't even calculated anything useful yet! I managed to pare it down enough for the Arduino to have enough memory to open the file on the SD card to write to it. Over this weekend I am going to go through and refactor my code some more.

I'm hoping this weekend, whilst we are away camping for the weekend, to try and capture a full 3 days worth of battery data. That is likely to be about the full runtime of my batteries, depending on the amount of sun and solar panel output. Once I get that data, I have a cunning plan. I'm going to try and write a simulator for the state of charge in Python on my laptop. I will be able to feed the raw data from the Arduino into it to run through a full 3 days in a number of milliseconds. This will allow me to tweak the algorithm and re-run it multiple times in order to try and get something that best matches the real world results as best I can. Alas this won't include any heavy charging from the engine, but should be a good start. The real goal for this is to have something that can keep track of my battery state over the space of a number of weeks involving multiple charge / discharge cycles and partial cycles.

New 'workshop'

Sorry I've not written much in a while. Truth is I've had hardly any time to work on the battery monitor. A few months back I managed to damage a trace on the Logshield board with my clumsy soldering and broke the 5v supply to the 3.3V regulator. That meant that the INA219 board (the voltage and current sensor) and the SD Card both had no power.

New magnifying glass and workbench
Since then we've managed to buy the house that we have been renting for the past 2 years (Yay!). As part of this I've been sorting out our garage and building better storage and a proper workbench in there. This now means I have a permanent place to work on the Arduino. I can now do soldering without worrying about melting the kitchen tablecloth! I also don't have to set up and tear down before every meal… so I can do some more ad-hoc work.

I also bought a cheap little magnifying glass off eBay. It is a great little unit with a weighted base, two croc clip claws on arms, a magnifying glass with LED lights and a soldering iron stand. Using this I was able to spot where I'd damaged the trace on the Logshield board. I was able to scrape away a bit of the protective top insulating layer on the board to expose the trace and solder down a strand of copper wire to repair it. It is not the prettiest repair, but hopefully should hold.

Last night I started putting everything back together again and put the Arduino in the van and connected it up to the 12v supply for power and to the shunt to measure current. The battery monitor now continuously transmits voltage, current and temperature readings via a MiRF chip. I have a second Arduino with another MiRF chip plugged into a laptop to read the readings and display them.

I'm pretty impressed with the range of the MiRF chips, with only an onboard PCB trace antenna I was still able to read the voltage from within my house, with the van parked outside. So that is going through the metal body of the van, and the wall of the house. And about 20 meters of air. As I'm only really wanting the RF transmission so that I can transmit data from the battery monitor to other Arduino units in the van (e.g. one with a 3G card so I can get data remotely, or to one in the van cab to display the readings) it has more than enough range.

The battery monitor is logging the values to the SD card on it, so I will be able to retrieve historical data, plot it, and try and work out a State of Charge (SoC) algorithm. The battery was fully charged when I left it for the dat today. I left the compressor fridge running, so I should get a day's worth of data as to how the current, voltage and state of charge relate. The sun is starting to come out and as I left the solar panel was putting in about 0.2A to the battery.

At the moment the current readings I've been seeing seem to vary quite a bit from what my Stecca solar regulator is reporting. I'm not sure which is accurate though. I did attempt to put my multimeter in series with the battery last night to see what it was reading, but for some reason it caused the load to cut in and out. I fear I may have shorted out my multimeter a while back and its current shunt is a bit damaged. If the current readings are out then it could point to the shunt not being the exact 15 milliohms that it reports to be. I don't have a meter accurate enough to be able to test that. I might see if the local Bristol Hackspace has a more accurate meter I can use.

This weekend we are away camping for the bank holiday weekend. We will be arriving on site on Friday evening and leaving Monday morning, so will have two and a half days running off the batteries so will see what data we can collect in that time.

Sunday 17 March 2013

New Bus Bars

I've been a bit quiet on here recently as I've been dealing with lots of non-van related stuff. One thing I've been meaning to do for a while is re-wire the electrics in my van to be a bit more robust. Originally all the cables came together onto a pair of M8 bolts (one for +12v and one for ground). But it was a pain to remove any cable, and I'm not sure the electrical connection was all that good.

So, I set about this weekend making up some nice heavy duty bus bars as part of my re-wiring project. These sort of things retail for about £50 each, and I certainly wasn't going to pay that!

I bought some stainless steel bar off ebay and cut it to length and drilled 7.5mm holes in it:

Posted Image

The holes were drilled with a battery powered handheld drill, so hence a bit wonky ;) And took quite a bit of time to drill through. A pillar drill here would have been ideal.

I bought a tap and die set and put an M8 thread in the holes. I bolted in some 25mm long M8 bolts. I also had a go at soldering the backs of the bolts to keep them in place and not turning when I do the nuts up on the front. This was a bit of an experiment as I know stainless steel can be difficult to solder unless you have the right flux. I used the normal flux and solder I use for copper pipe fittings and after heating it up with a blow torch I was able to get the solder to flow on pretty nicely. It needed quite a bit of cleaning up afterwards as the flux was all blackened.

I then glued the bars to some wooden blocks as standoffs. I should have left a bit more bar either end and then could have drilled a small hole in and screw it down, but I didn't leave enough room for this.

Finished bars:

Posted Image

And in place in the van:

Posted Image

I plan to put a dividing 'wall' between them and maybe a cover to reduce chance of shorting something across them accidentally.

I now have the shunt for the battery monitor permanently fitted in place, so can  now connect up the battery monitor. I'm still waiting for a FTDI cable from China to turn up so that I can program the Xino Basic board I have without having to resort to swapping chips around.

Saturday 16 February 2013

Simple, but it works

I have now removed the INA219 breakout board from my Arduino. It took quite a bit of work with the soldering iron to get it off. It is definitely toast. Putting 5v across it and it gets finger-burningly hot pretty quickly. So, I've ordered another one which should be here in a few days.

In the meantime I still wanted to try and get some more charge at 14.4V into my battery. As you may remember the last attempt to charge the battery stopped shortly into the constant 14.4v 'absorption' phase.

So I went old-skool and built a simple voltage divider using a 24K and 10K resistor on a breadboard. I calibrated in software against my digital voltmeter. I wrote a simple Arduino sketch to read the voltage from the analog input connected to the middle of the voltage divider and adjust a PWM pin connected to my MOSFET board accordingly.

I tuned the algorithm a bit to try and stop the oscillation I was seeing before:

void loop() {
  last_voltage = voltage;
  // read the input on analog pin 0:
  int sensorValue = analogRead(A0);
  // Convert the analog reading (which goes from 0 - 1023) to a voltage (0 - 5V):
  voltage = sensorValue * (5.0 / 1023.0) * ((25+10.0)/10.0) * 0.989;
  // print out the value you read:
  Serial.println(voltage);

  if (voltage > 14.4 && voltage >= last_voltage) {
    output_level -= 1;
    if (output_level < 0) {
      output_level = 0;
    }
  } else {
     output_level += 1;
     if (output_level > 255) {
      output_level = 255;
    } 
  }
  Serial.println(output_level);
  analogWrite(6, output_level);
  
  delay(500);
}

It seems to work and when the charger got to 14.40V it kept pretty close to that value and only oscillated by about 0.01V.

Arduino and breadboard with voltage divider on it to read voltage from battery

I am not able to log the current and voltage like before, so can't produce any graphs, but at least I can give the battery a good absorption charge. I can hear a bit of bubbling going on, so will check in a bit and may adjust the voltage down a bit if it gets too much.